
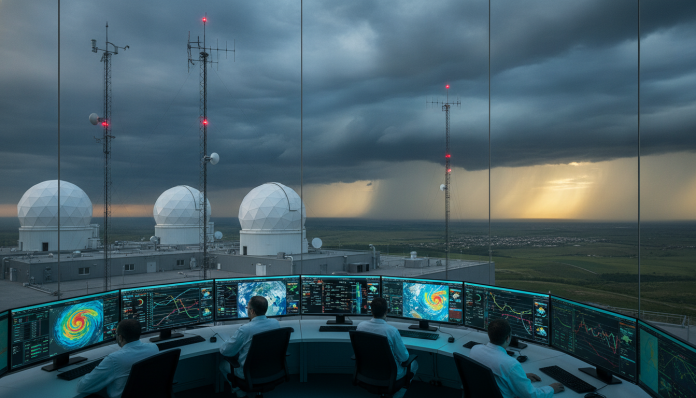
You open your phone app, check the cloud and lightning icon, and decide to bring an umbrella. But where does that information come from? How is that number on the screen — “70% chance of rain” — generated from the chaos that is Earth’s atmosphere? Weather forecasting is one of the most underestimated scientific achievements of modern everyday life, present in everyone’s life, but rarely truly understood.
Behind that percentage exists a complex and fascinating chain: satellites orbiting hundreds of kilometers above the ground, supercomputers processing billions of calculations per second, weather stations spread across the four corners of the planet, and teams of meteorologists interpreting all of this in real time. It’s cutting-edge science applied to a simple question: will it rain tomorrow?
The good news is that this science has evolved impressively over recent decades. A five-day forecast today has accuracy comparable to a 24-hour forecast made in the 1980s. And understanding how this process works helps not only to better use weather apps, but also to understand the limits — and the wonders — of trying to tame the unpredictable.
Where the data comes from: the eyes of meteorology
Before any forecast, you need to know what’s happening now. This may seem obvious, but the collection of meteorological data on a global scale is, in itself, a monumental logistical operation.
Land weather stations
Spread across all continents, weather stations measure fundamental variables: temperature, air humidity, atmospheric pressure, wind speed and direction, precipitation, and solar radiation. Brazil has networks operated by INMET (National Institute of Meteorology), linked to the Ministry of Agriculture, as well as state and private networks.
These stations send data automatically at intervals of minutes or hours, continuously feeding national and international databases.
Meteorological satellites
Satellites are the great modern protagonists of meteorology. They operate in two main types of orbits:
- Geostationary orbit: they stay at about 36,000 km altitude, always over the same point on Earth. They allow continuous monitoring of a region, capturing images every 10 or 15 minutes. GOES-16, operated by the United States and covering much of South America, is a classic example.
- Polar orbit: they cross the globe from pole to pole at lower altitudes (600 to 800 km), obtaining much more detailed images, but of each region only a few times a day.
Satellites capture not only visible images (like those that appear in news reports), but also infrared radiation — which allows measuring cloud and ocean temperatures, identifying humidity patterns, and detecting forming storms.
Radiosondes and aircraft
Every day, around the world, thousands of radiosondes are launched into the atmosphere attached to helium balloons. They rise to about 30 km altitude and transmit real-time data on temperature, humidity, and pressure in different layers of the atmosphere before falling back to Earth. This vertical profile of the atmosphere is essential for understanding weather behavior in the coming hours.
Commercial aircraft also contribute: equipped with sensors, they transmit temperature and wind data during flights, generating a huge network of altitude observations.
Numerical models: the mathematics of climate
With all that data in hand, the heart of modern forecasting enters the scene: numerical weather prediction models (NWP).
A numerical model divides the atmosphere into a three-dimensional grid — imagine a mesh of cubes covering the entire Earth, from the ground to the stratosphere. Each point in this grid receives the observed data as an initial condition. Next, a set of mathematical equations based on atmospheric physics (the Navier-Stokes equations and thermodynamics, among others) is applied to calculate how each variable will evolve over time.
The result is a forecast of the state of the atmosphere in 6 hours, 12 hours, 24 hours, and so on — sometimes reaching 15 or more days.
Some of the most used models in the world include:
- GFS (Global Forecast System): operated by NOAA, in the United States. It is publicly accessible and serves as the basis for many forecast apps.
- ECMWF (European Centre for Medium-Range Weather Forecasts): considered by many experts the most accurate global model in the world, based in Reading, UK.
- ICON: model from the German meteorological service (DWD), widely used in Europe.
- BAM (Brazilian Atmospheric Model): developed by INPE (National Institute for Space Research), focusing on Brazilian territory and the specificities of tropical climate.
These models run on supercomputers with processing capacity among the largest in the world for civilian use. ECMWF, for example, operates systems capable of performing hundreds of petaflops — that is, hundreds of quadrillions of mathematical operations per second.
The role of meteorologists
However impressive the technology, numerical models are not infallible. This is where the meteorologist comes in — the professional who interprets raw data and adds the regional knowledge that the computer, alone, still cannot fully capture.
Local phenomena such as sea breezes, orographic effects (influence of mountains and ranges on climate), and urban heat islands require specialized reading. A good meteorologist knows the climate history of his region, identifies patterns that models tend to get wrong, and makes adjustments that make the final forecast more reliable.
In addition, meteorologists produce what are called ensemble forecasts: instead of running a single model, they run dozens of versions with small variations in initial conditions. The degree of agreement between these versions indicates the level of forecast confidence — and that’s where the famous percentages of probability of rain come from.
What does “70% chance of rain” mean?
That percentage confuses many people. It does not mean that it will rain in 70% of the predicted area, nor that it will rain 70% of the day. The correct interpretation is probabilistic: under atmospheric conditions similar to current ones, historically rain occurred 70% of the time.
Other elements you see in apps also have important nuances:
- Minimum and maximum temperature: refer to the coldest point (usually overnight) and hottest (usually in the afternoon) of the day.
- Heat index: combines actual temperature with humidity and wind to estimate how the human body perceives heat or cold.
- UV index: measures the intensity of solar ultraviolet radiation, with a scale of 0 to 11+. Above 8, it is already considered very high — and Brazil, by its tropical location, frequently registers extreme values.
- Atmospheric pressure: rapid pressure drops usually indicate the approach of bad weather fronts.
Why forecasts fail — and why this is inevitable
The atmosphere is a chaotic system in the mathematical sense of the term. This means that small variations in initial conditions can generate large differences in results over time — the famous “butterfly effect,” a concept popularized by meteorologist Edward Lorenz in the 1960s.
No matter how much instruments improve, there will always be uncertainty in initial observations. And this uncertainty amplifies as the forecast period increases. Therefore:
- Forecasts of up to 3 days are usually quite reliable.
- From 4 to 7 days, reliability decreases, but is still useful for general planning.
- Above 10 days, forecasts become more of a climate trend than a detailed forecast.
This also explains why different forecast apps can show different results for the same location: they use different models, spatial grids, and adjustments.
How to use weather forecasting more intelligently
Now that you understand how the process works, here are some practical tips to better take advantage of meteorological information:
- Consult official sources for important events: INMET, state Civil Defense, or Climatempo (in Brazil) usually have more locally contextualized information than generic apps.
- Prefer short windows for important decisions: if you’re going to organize an outdoor barbecue, check the forecast 24 to 48 hours before, not a week in advance. In fact, good meteorological planning can save any event — even a perfect barbecue.
- Understand the probability of rain as a risk, not as a certainty. 30% is already a considerable chance depending on context.
- Observe the local pattern: if you live in a region with afternoon rains in summer, the forecast of rain “in the afternoon” has a different pattern than a cold front that can last days.
- Use more than one app or model to compare trends in critical situations, especially during seasons of extratropical cyclones or intense rainfall seasons.
Conclusion: science, humility, and the future of forecasts
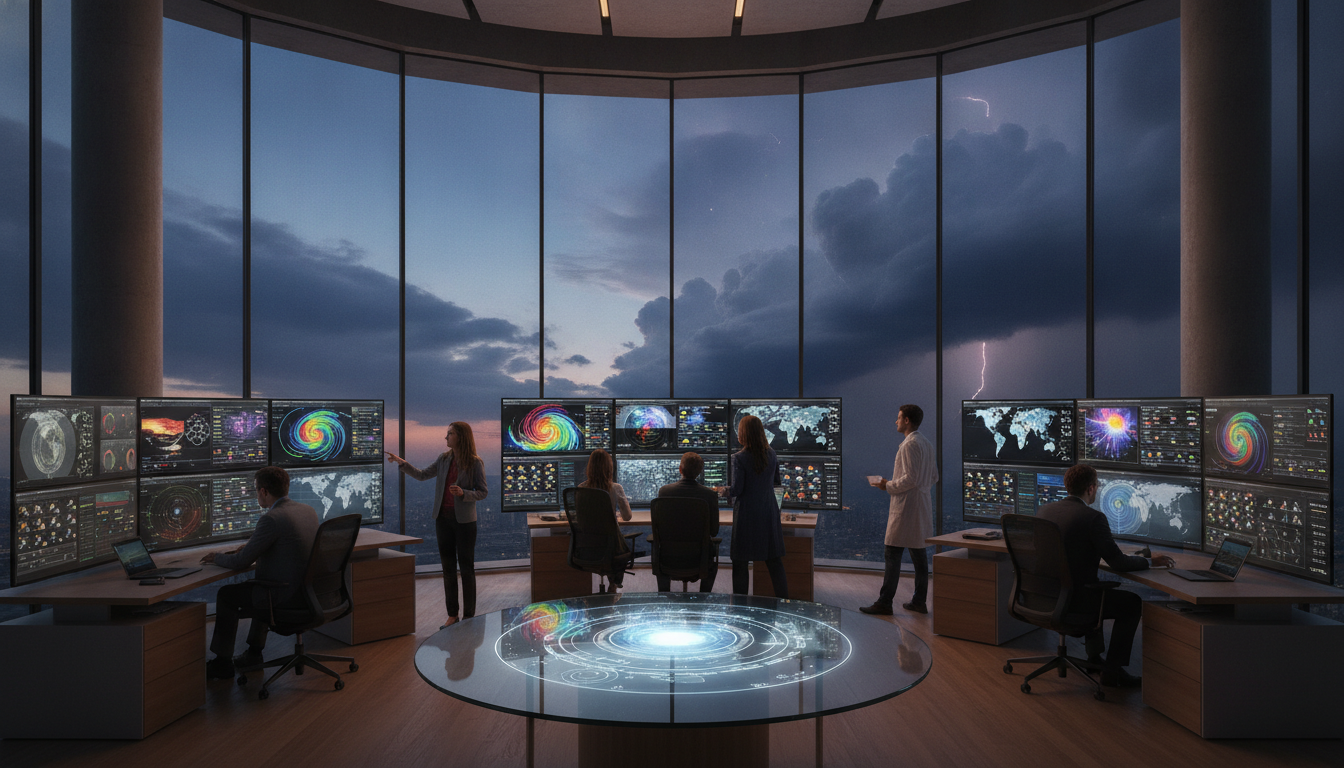
Weather forecasting is one of the greatest examples of how science can transform everyday life. In just a few decades, we have gone from simple visual observations of the sky to integrated systems of satellites, supercomputers, and mathematical models capable of anticipating the movement of a cold front thousands of kilometers away.
At the same time, meteorology is a discipline that teaches humility. Nature is too complex to be completely mastered by equations — and the world’s best meteorologists are the first to acknowledge this. What science offers is not certainty, but the best possible estimate in the face of chaos.
With the advancement of artificial intelligence and machine learning, models are becoming increasingly accurate, especially in medium-term periods. Technology companies and research centers are already training neural networks with decades of historical data to find patterns that traditional equations do not capture. The future of weather forecasting promises to be even more impressive — and, who knows, one day that cloud and lightning icon will be virtually infallible.
Until then, bringing an umbrella when the chance of rain exceeds 50% remains, mathematically, the most sensible decision. And understanding the science behind it makes the gesture even smarter. The universe, after all, is full of phenomena that seem simple at a distance but hide surprising depth — as explored in Space is stranger than you imagine.